


Bitcoin (BTC) risks starting its “next downtrend” as bulls fail to break beyond $82,000, the latest analysis warns.
Key points:
- Bitcoin traders are beginning to sway toward a support retest or even a new “downtrend” for BTC/USD.
- Current price behavior has retained overhead resistance, with bulls unable to push through $82,000.
- Rangebound crypto markets spark $330 million in liquidations over 24 hours.
Trader: BTC price will “likely break below” support
Bitcoin traders are increasingly split on where BTC/USD will go next, but calls for lower levels are growing.
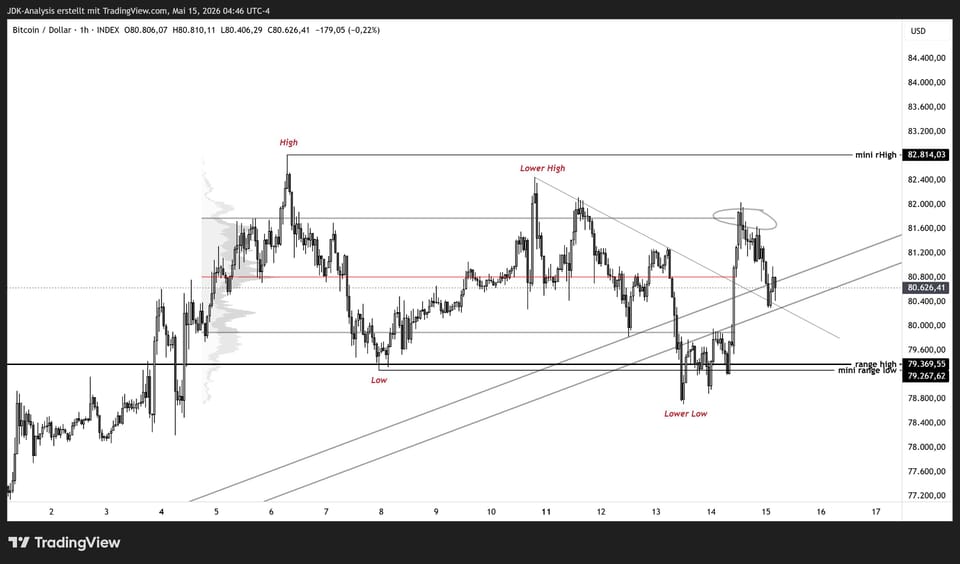
“For now, price remains in range, within value, rotating just above the very key ‘range high,’” trading account JDK Analysis wrote in its latest updates on X.

BTC/USD one-hour chart. Source: JDK Analysis/X
As Cointelegraph reported, that rangebound construction, in place through most of May, is bordered by a CME futures gap and a key 200-day trend line to the upside.
With both staying in place for now, market participants are starting to assume that the bottom of the range will be retested instead.
“Now it’s important to watch how price reacts at the support zone we already bounced from once before. In my opinion, we will likely break below it this time,” CGT Trader said.

BTC/USD one-hour chart. Source: CGT Trader/X
Trader BitBull went further, seeing the risk of a protracted period of downside BTC price pressure about to enter.
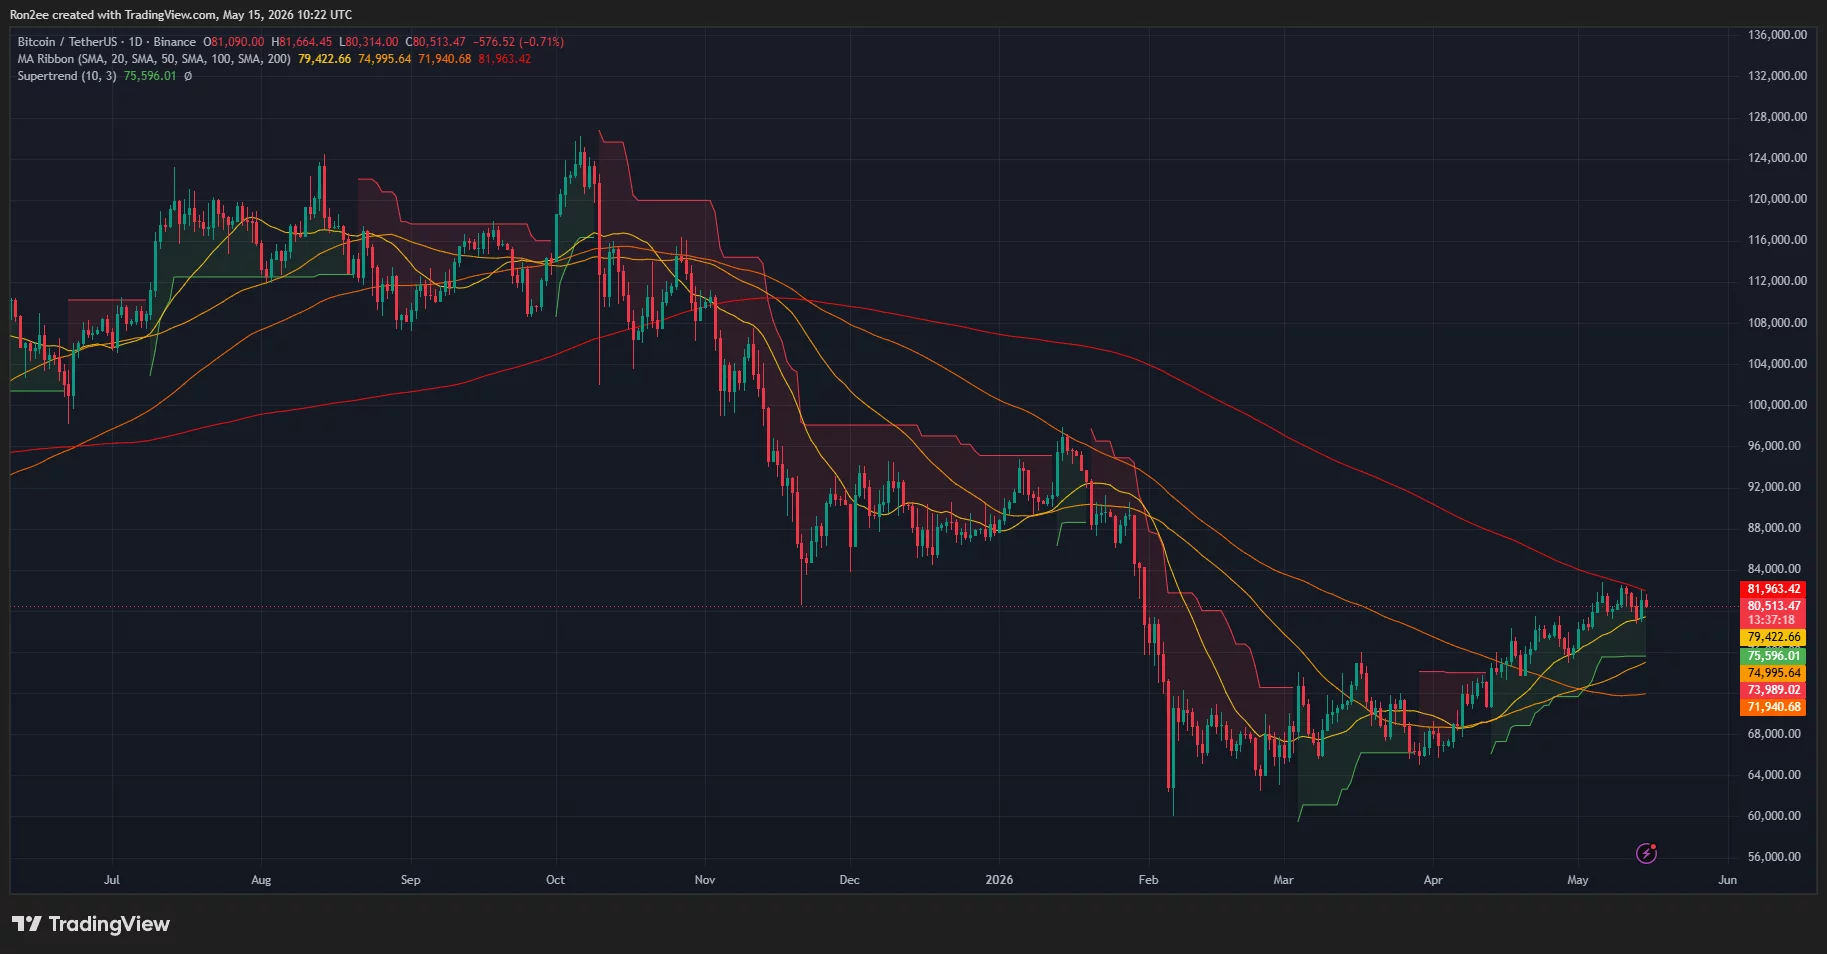
“$BTC failed to reclaim the $82,000 level again,” they told X followers on Friday.
“It seems like the next downtrend could start soon.”

BTC/USDC one-day chart. Source: BitBull/X
Hopes for Bitcoin’s “massive catch-up” to stocks persist
Trading circles are not without their more optimistic takes.
Related: Bitcoin price history suggests 77% odds of new all-time high within a year
Cryptic Trades predicts that BTC/USD will follow in the footsteps of US stock markets, which continue to post new all-time highs.
“$BTC is going to play a massive catch-up in the upcoming weeks,” it summarized.
Examining the Bollinger Bands volatility indicator, meanwhile, trader Cai Soren said that bulls “stepped in instantly” to defend support.
Earlier, Cointelegraph noted bullish signals from the bands, which even caused their creator, John Bollinger, to act.
“As long as support keeps holding, momentum still looks strong for continuation higher,” Soren forecast.

BTC/USDT four-hour chart with Bollings Bands data. Source: Cai Soren/X
Data from CoinGlass shows the impact of rangebound moves across crypto markets, with 24-hour liquidations roughly equal across both long and short positions.
These totaled around $330 million at the time of writing.

Crypto liquidation history (screenshot). Source: CoinGlass