


Bitcoin is navigating heightened uncertainty as escalating conflicts in the Middle East inject fresh volatility into global markets. Price action has become increasingly reactive to geopolitical headlines, while broader liquidity conditions remain fragile. In this environment, directional conviction has weakened, and risk appetite appears constrained.
Recent analysis from Axel Adler highlights the deterioration in Bitcoin’s risk-adjusted performance profile. The Sharpe Ratio — measured over both 365-day and 180-day rolling windows — has moved decisively into negative territory. As of March 1, 2026, the 365-day Sharpe stands at -63, while the faster 180-day version has plunged to -287. Although the metric is scaled for regime analysis rather than interpreted as a classical Sharpe value, the implication is clear: over the past six to twelve months, volatility has not been compensated by returns.

This shift began in January and accelerated through February’s price pressure. Notably, the fast Sharpe reading is approaching levels seen near the 2022 cycle low, while the slower measure remains less extreme but firmly negative. Complementing this signal, the MVRV Z-Score sits at 0.49 — below its historical mean but not at capitulation extremes.
The report further contextualizes Bitcoin’s positioning through the MVRV Z-Score with Standard Deviation bands. As of early March 2026, the Z-Score stands at 0.49 — below both its 365-day moving average (1.89) and historical mean (1.73), yet comfortably above the negative territory historically associated with capitulation. Structurally, this places Bitcoin in a neutral valuation regime.

The MVRV Z-Score measures the deviation between market capitalization and realized capitalization, effectively comparing spot price to the aggregate cost basis of holders. Historically, readings above +1 standard deviation (around 3.55) have signaled overheating, while negative readings — when price trades below average holder cost — have marked major accumulation zones in 2019, 2020, and 2023. The current 0.49 reading indicates neither excess profit-taking pressure nor deep undervaluation.
This distinction is critical. The absence of overheating reduces the probability of an abrupt collapse driven by profit overhang. However, neutrality does not equate to opportunity. Historically strong buy signals emerged when MVRV moved decisively negative, not merely when it cooled toward 0.5.
Combined with the negative Sharpe Ratio regime, the message converges: risk-adjusted returns are unattractive, and valuation is neutral but not historically cheap. This is a transitional phase requiring a clear catalyst to define direction.
On the 3-day timeframe, Bitcoin remains structurally pressured following the breakdown from the $90,000–$95,000 distribution range. The chart shows a decisive rejection near the 200-period moving average (red), which had previously acted as dynamic support throughout much of the 2024–2025 uptrend. Once lost, price accelerated lower, confirming a transition from trend continuation to corrective structure.
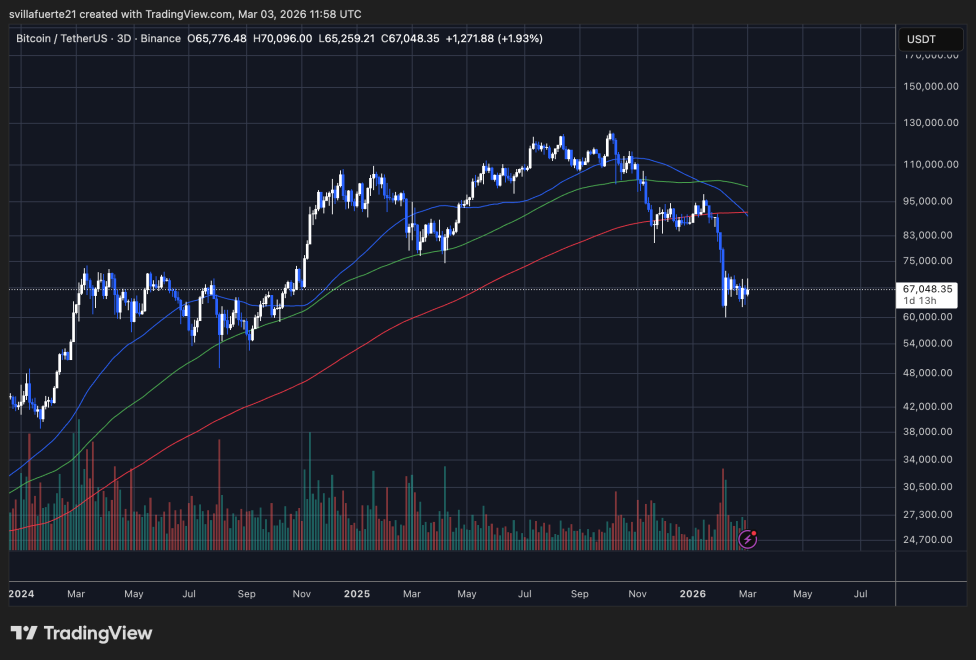
Currently trading near $67,000, BTC is consolidating below the 100-period (green) and 50-period (blue) moving averages. Both shorter-term averages are curling downward, reflecting deteriorating momentum. The recent rebound from the $60,000–$62,000 region appears corrective rather than impulsive, lacking strong volume expansion relative to the breakdown phase. This suggests short-covering and tactical positioning rather than broad structural accumulation.
Importantly, the $60,000 zone now represents key horizontal support. It coincides with a prior consolidation area and marks the lower boundary of the current range. A sustained loss of this level would likely expose the $52,000–$55,000 region as the next high-liquidity demand zone.
For bulls to regain structural control, price would need to reclaim and hold above the 100-period average and reestablish higher highs on expanding volume. Until then, the dominant regime remains corrective, with volatility compressing inside a fragile recovery attempt.
Featured image from ChatGPT, chart from TradingView.com
Editorial Process for bitcoinist is centered on delivering thoroughly researched, accurate, and unbiased content. We uphold strict sourcing standards, and each page undergoes diligent review by our team of top technology experts and seasoned editors. This process ensures the integrity, relevance, and value of our content for our readers.